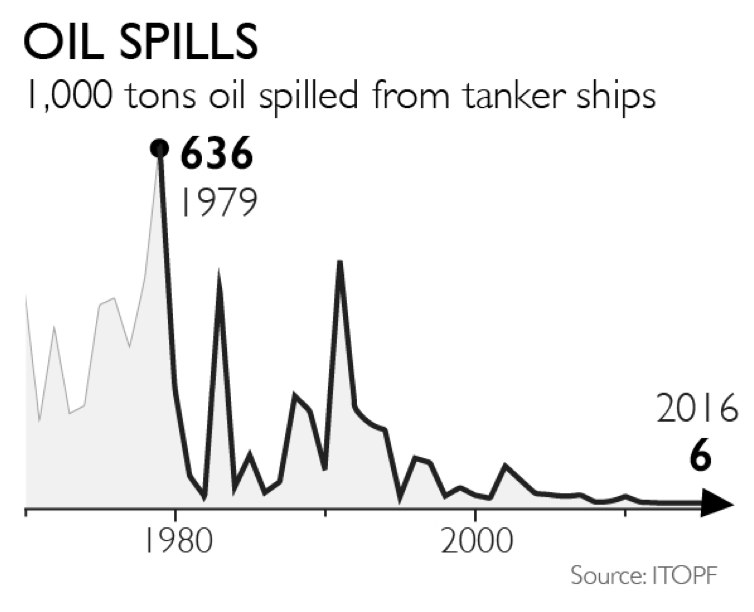
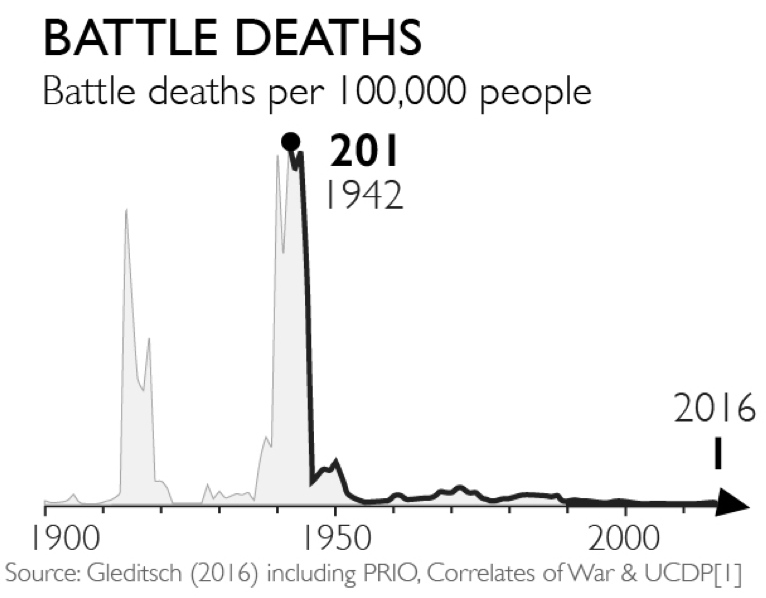
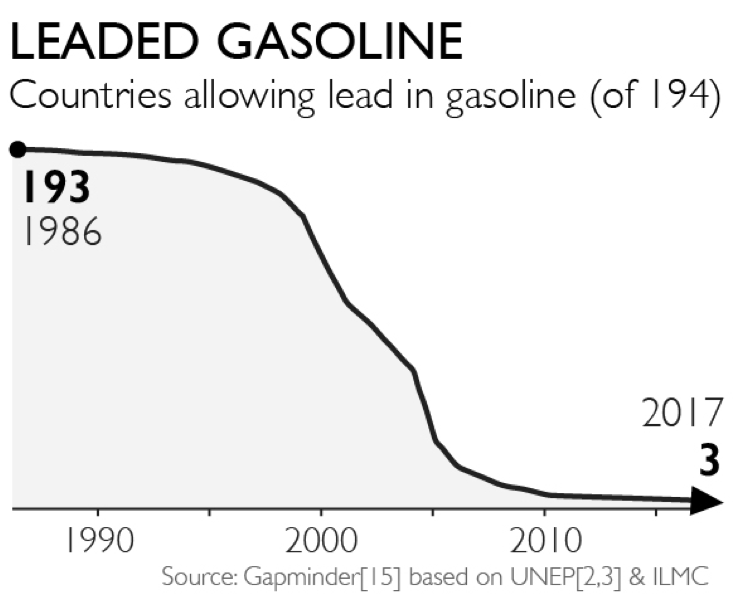
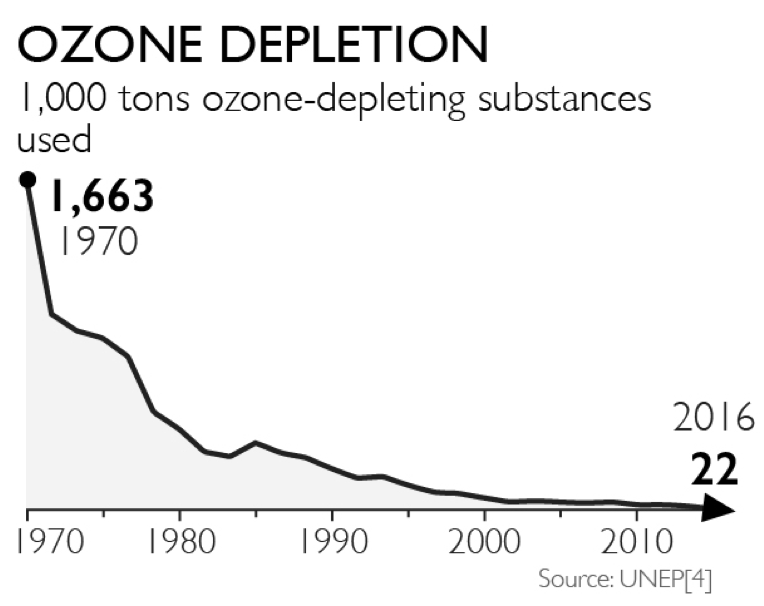
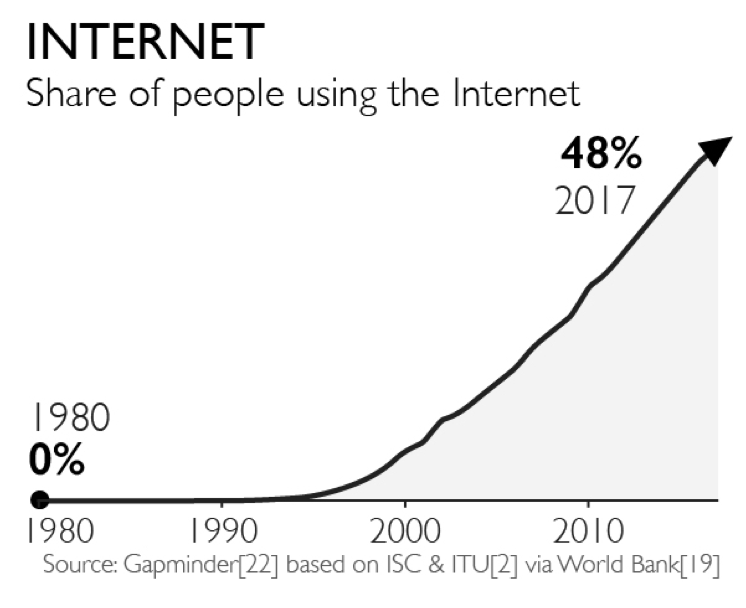
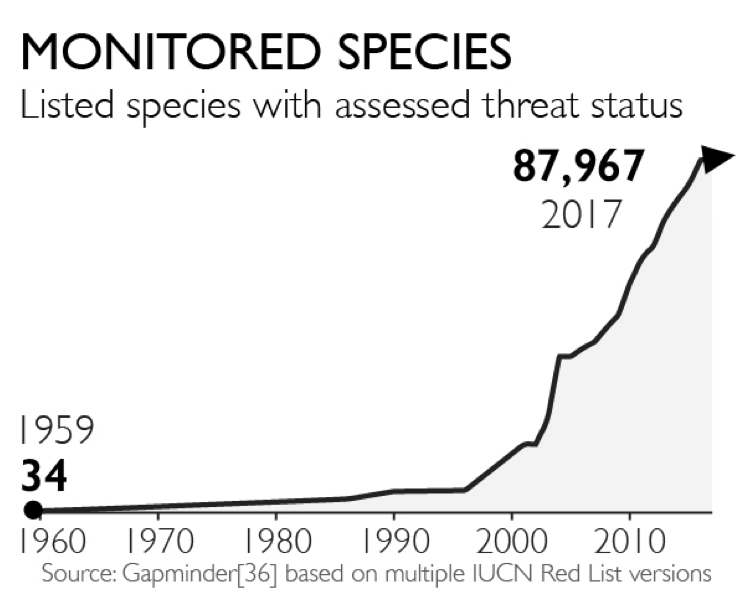
Below are the 32 improvement graphs that are printed in the book Factfulness, on pages 60 to 63 in the English edition.
To learn about the data sources behind these charts, please see this link to page 60 on the page with detailed notes».
This is a temporary solution while we are publishing one page per chart. Our plan is to make all data behind these charts (and all other charts in the book too) available as soon as possible. We really thought we would have done so already before the book was released, but we didn’t manage in time. We’re still working hard on this, and during the next couple of weeks we are also publishing hundreds of pages that are linked to from the book. This page is one of them. Please stay tuned on Facebook or Twitter where we will be posting about all updates. If you’ve got questions, please use the Gapminder Discussion Forum. Sorry for the inconvenience!
16 bad things decreasing
Documentation of the graphs below will be improved soon!






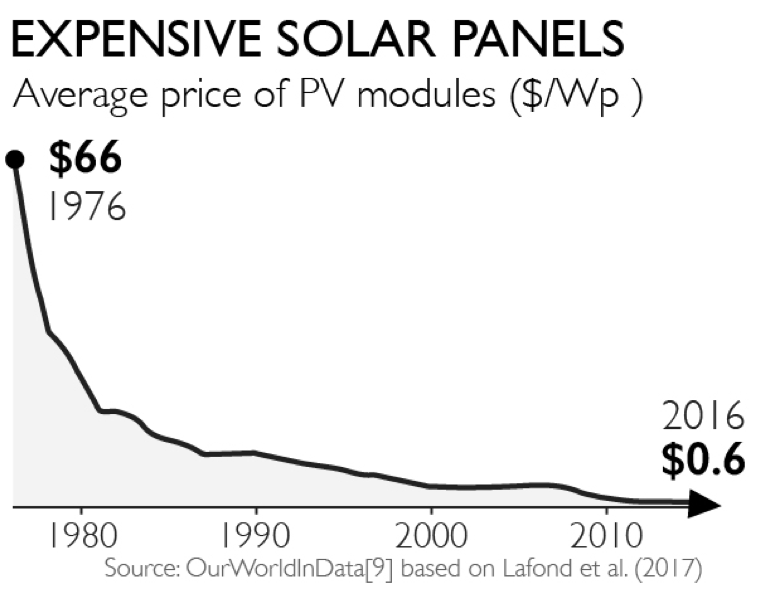
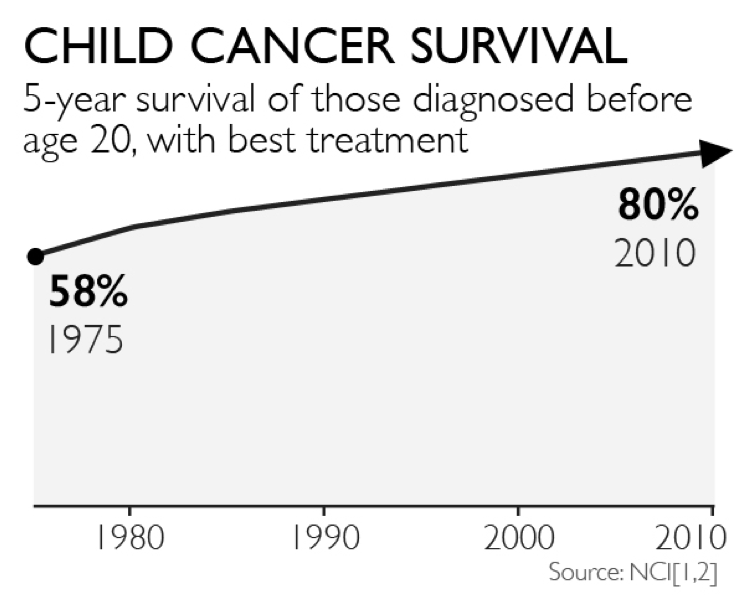
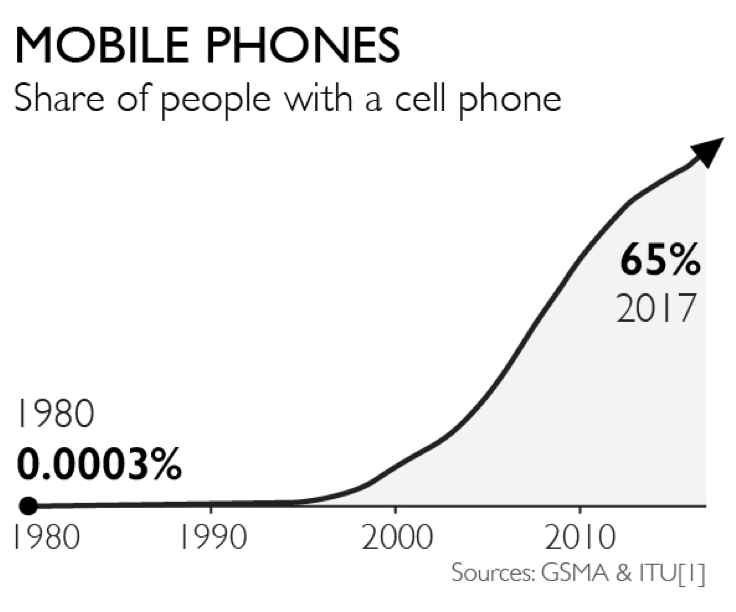
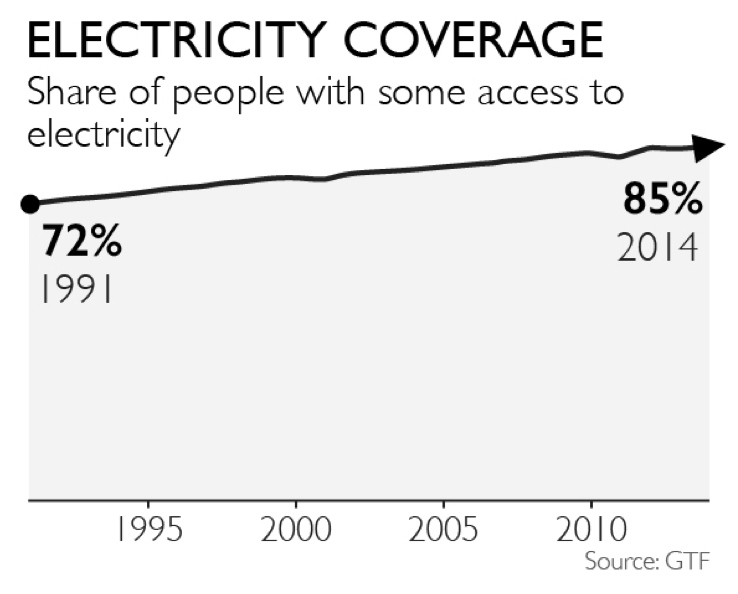
16 good things increasing







***
This page is under construction. We are working on it (and a lot of other pages too). If you need this particular page urgently, you can always drop us a line, and we might be able to squeeze it to the top of our prio list…
Contact us at [email protected].
Japanese: このページを含め、多くの出典ページは現在改稿中です。

